Eduseek.AI
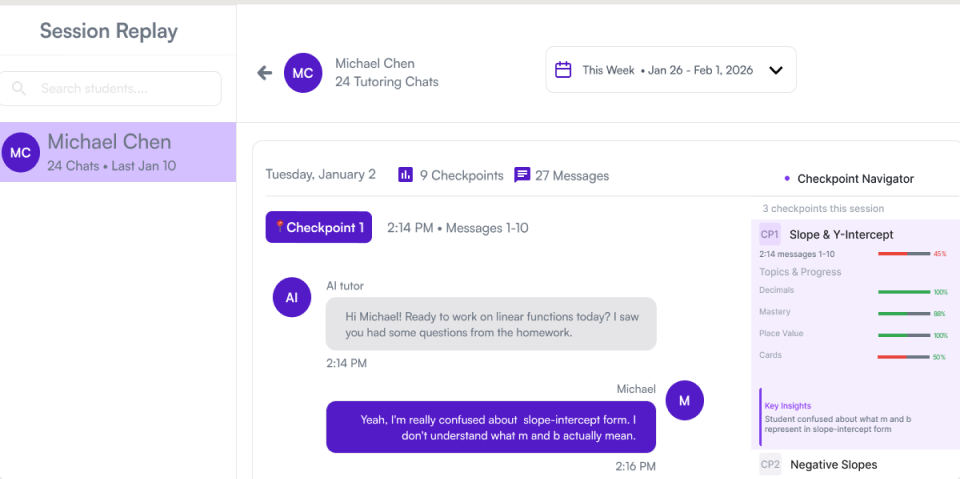
Timeline
Nov 2025 - Feb 2026
Role
UX Designer
Tools
Figma, Magic Patterns
Deliverables
Calendar Navigation, Key Insights Feature, Mobile Adaptation
Outcome
From an 8-click bottleneck to a 3-click habit
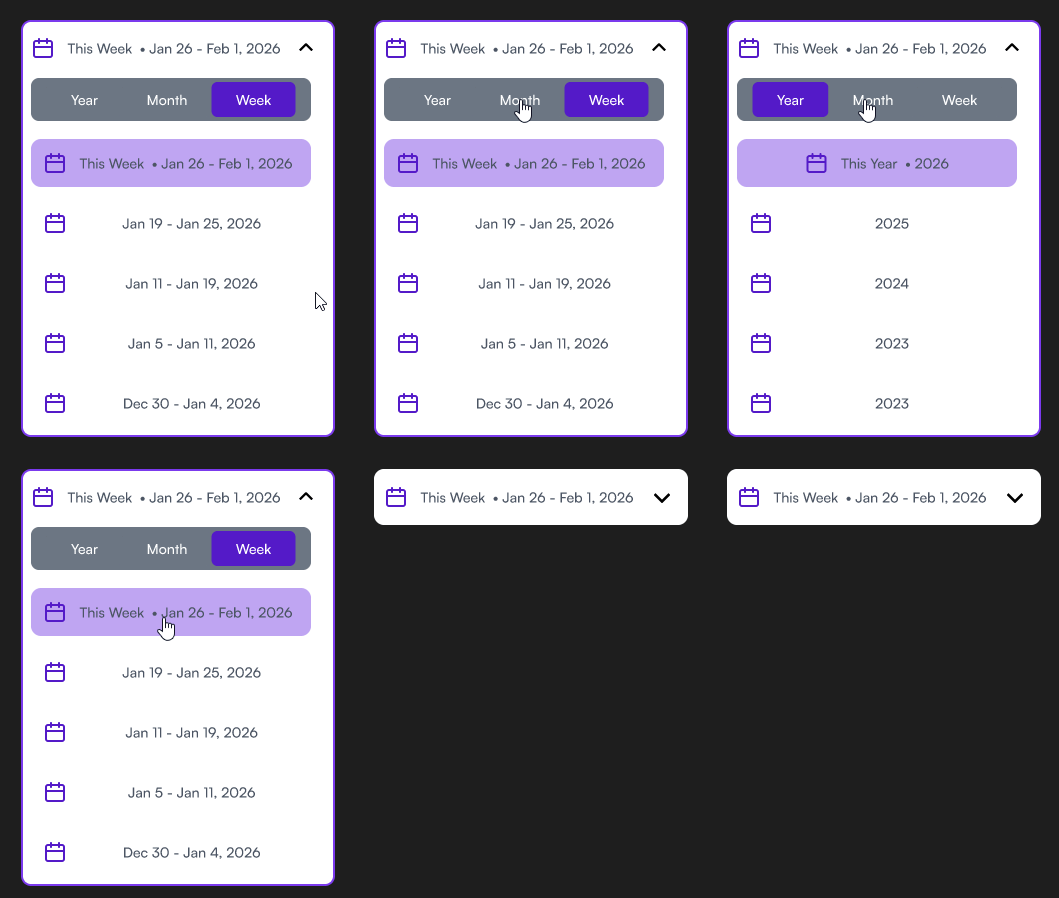
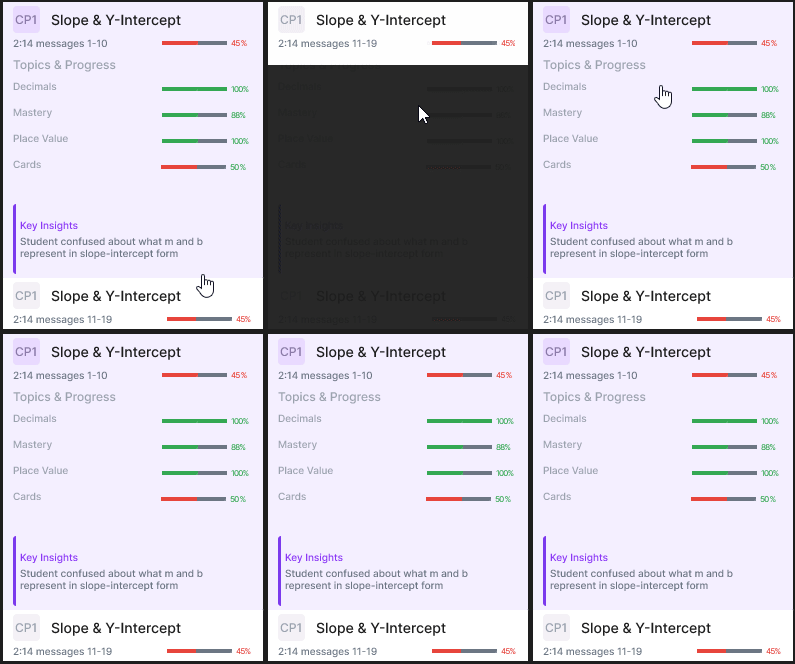
Sixteen weeks of working directly with the CEO turned a UI refresh request into a full diagnostic of how teachers actually use the product. Testing confirmed calendar navigation dropped from 8 clicks to 3. The Key Insights feature I designed shipped as the solution the CEO specifically flagged for surfacing actionable data at no added AI generation cost. The mobile rebuild took a session replay experience from unusable to fully functional on phones and tablets. What started as a UI refresh became the redesign that reshaped how 17 schools review student progress.
Context
The platform
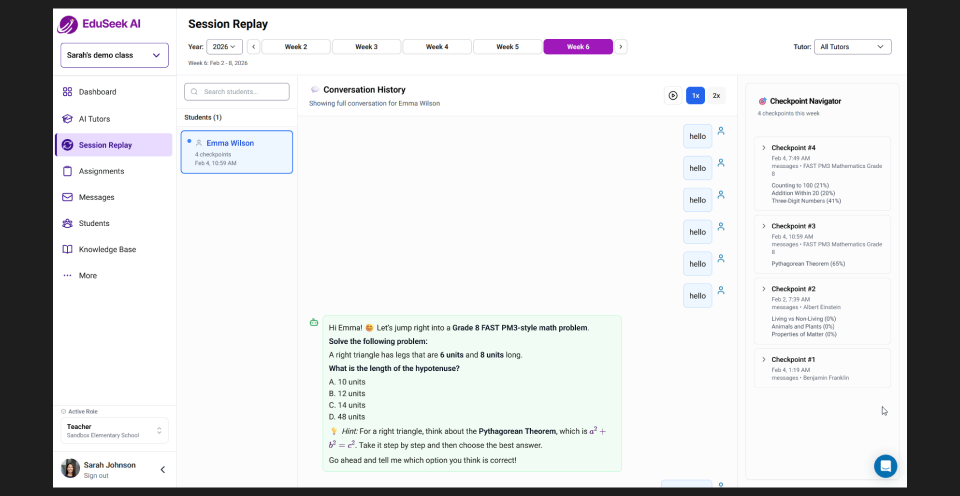
EduSeek.AI is a B2B EdTech startup building AI tutoring tools for schools and teachers. Their session replay system lets teachers review AI tutoring conversations and student interactions. I joined as the sole designer for 16 weeks, working directly with the CEO.
Problem
The data existed, but teachers couldn't use it
Teachers were spending hours reviewing tutoring sessions, but the interface made it nearly impossible to find what they needed. Navigation took 8+ clicks to reach a single conversation, mastery scores showed up with no context behind them, and the whole system only worked on desktop. The data existed. The experience to act on it didn't.
Pain Point 1

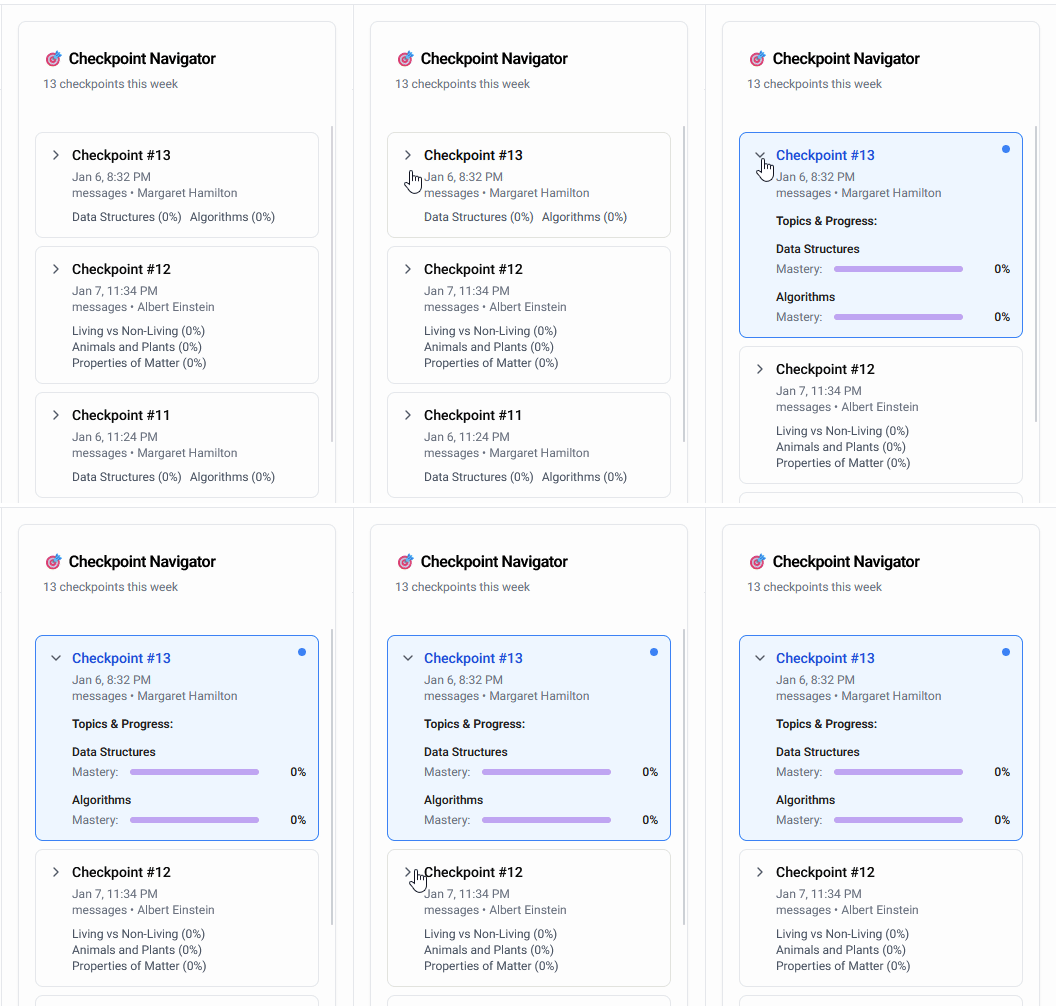
Teachers were clicking blind
Teachers were spending 8+ clicks to reach past sessions, and the existing system would jump straight to the end of the week on click, making it nearly impossible to find a specific conversation.
Pain Point 2
Numbers with no story behind them
A mastery score told teachers nothing about where a student actually struggled. Teachers were staring at numbers with no context to act on.
Design Decisions
From 8 clicks to 3, with navigation that stays put
I tried keeping the existing single-scroll week list and just restyling it, since that was the original ask. But testing showed the design still had teachers clicking 8+ times, and the jump-to-end-of-week behavior meant one wrong click cost a full re-navigation.
Fix: built a Year / Month / Week toggle so any session was reachable in 2-3 clicks, with navigation that holds its position instead of resetting.
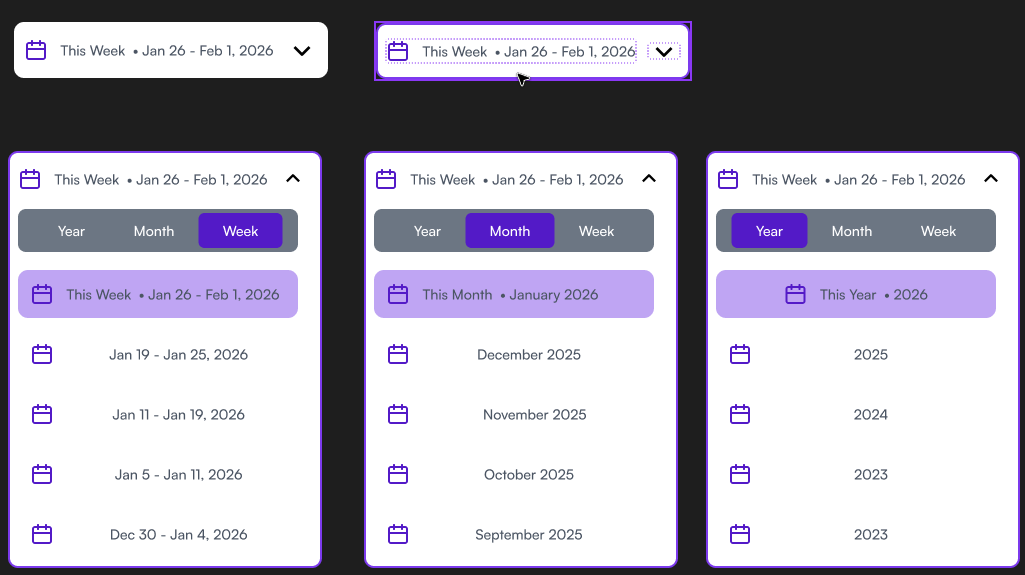
Process: iterated on component states in Magic Patterns before finalizing in Figma, so designs were production-ready from the start.
Design Decisions
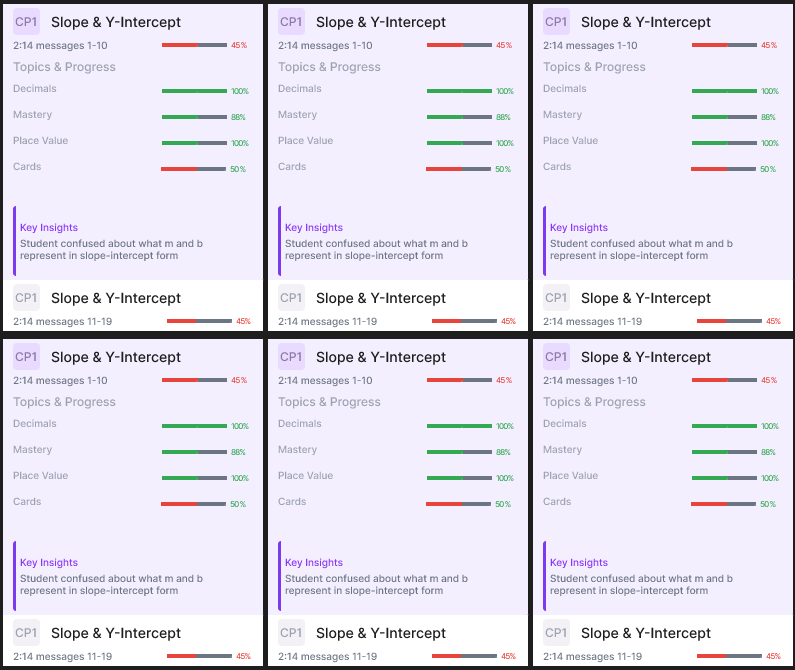
Surfacing the story behind the score
I designed a Key Insights feature that auto-summarizes the critical learning moments from each AI conversation at no additional generation cost, paired with color-coded progress meters so teachers can read comprehension at a glance and act on it, not just observe it.
Design Decisions
Extending access beyond the classroom
Teachers review student progress on the go, not just at their desks, but the existing mobile interface made session replay nearly unusable. I rebuilt the mobile experience to preserve full functionality across phones and tablets, matching the desktop redesign instead of trailing behind it.
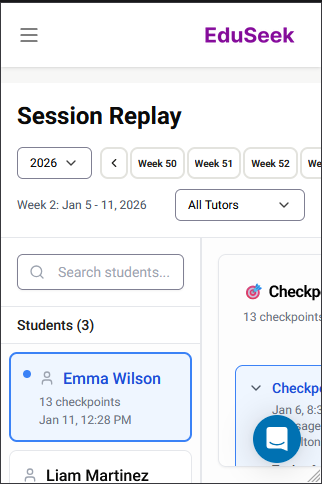
Original mobile view with break due to components not adjusting.
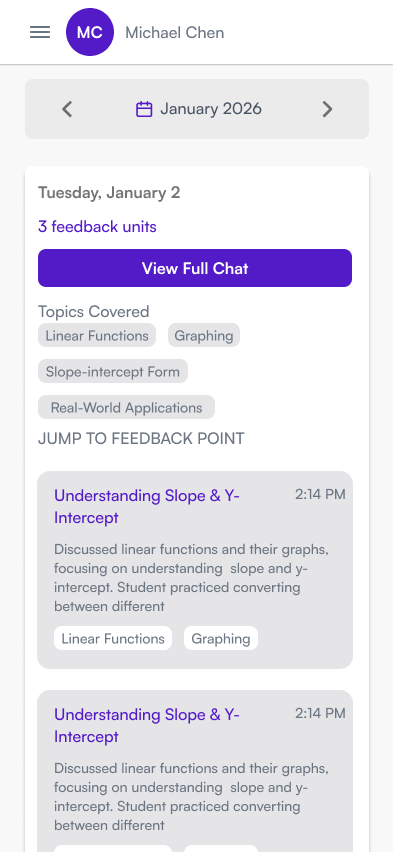
Redesigned mobile components to match the new UI and work properly at mobile screen sizes.
Outcome
What I learned
What started as a UI redesign became a focused diagnostic. Over 16 weeks working directly with the CEO, I solved the core friction points teachers were actually hitting, not just the ones in the original brief.
Calendar navigation dropped from 8 clicks to 3. Key Insights shipped as the solution the CEO flagged for surfacing actionable data at no added AI cost. The component library grew from 14 to 17, making handoff to dev straightforward.
Try it
INTERACTIVE PROTOTYPE
Explore the session replay dashboard prototype below, built in Magic Patterns to test the calendar navigation and Key Insights feature before handoff to engineering.